Debugging in Java
Table of Contents
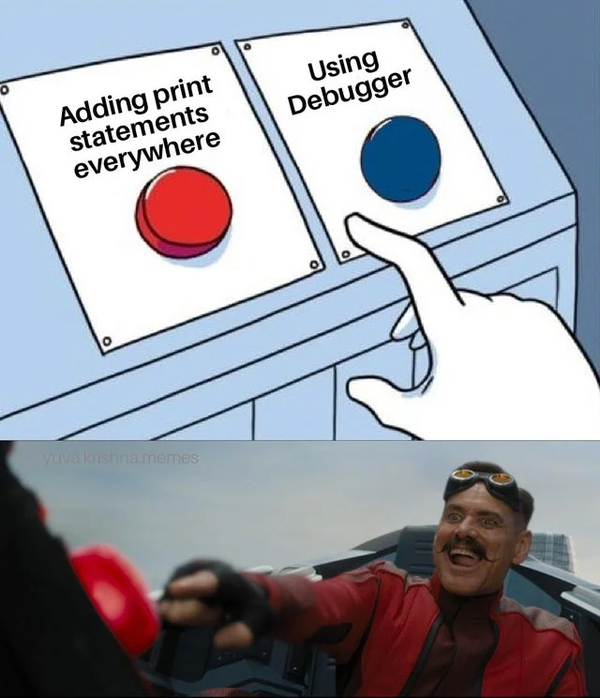
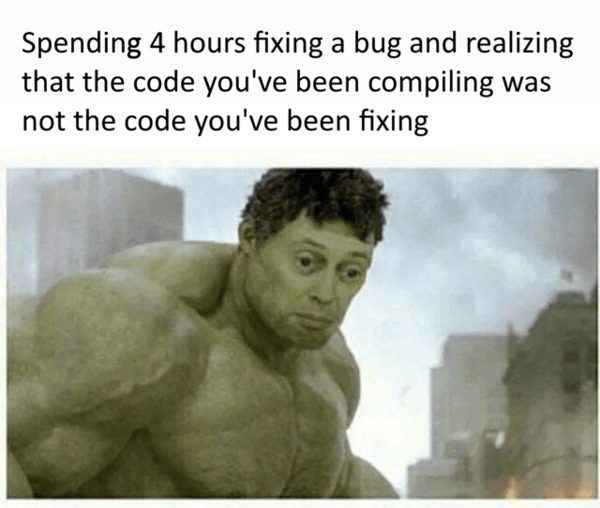
A guide to effective debugging techniques in Java We all write perfect code on first attempt, right? In this tutorial, we will learn how to understand the errors in our code and how to fix them. The Java compiler has a great way of informing you of problems in your code. It will tell you the line number and the type of problem. It will also tell you if there are multiple problems on the same line. Example: Output: This is the path to the file that has the error. This help you identify the file that has the error. Look at the end of it to see the file name. The file name is This part of the output tells you the line number of error. You can see the number of line in the left of side of IDE’s editor. So you can go to the line number and see what the problem is. The line number is This part of the output tells you what the problem is. In this case, it is telling you that you are missing a semicolon. There are many other errors that you can get. Some of These errors are easily understandable and some of them are cryptic. :b In a case you can’t understand the error, you can search it on the internet. Remember, as a programmer, The internet is your best friend. This is an amazing feature of the Java compiler. It tells you the exact location of the error. So no more wondering where the error is in a long line of code. This part of the output tells you the number of errors in your code. Yes Java compiler can tell you if there are multiple errors in your code. In this case, there is only one error. This part of the output tells you the type of error. In this case, it is telling you that the compilation failed. This line is not part of the Java compiler output. This line is the output of the shell. But it is still useful to know that the shell returned 1. A return value of 0 means that the program ran successfully. A return value of 1 means that the program failed to run. Here value of 1 means that the program failed to compile. Example: Output: file name: line number: error: number of errors: type of error: missing: Example: Output: file name: line number: error: number of errors: type of error: missing: Example: Output: file name: line number: error: number of errors: type of error: this code is not a valid statement. Example: Output: file name: line number: error: number of errors: type of error: missing: Most popular IDE’s support the Language Server Protocol. This feature allows you to see the errors in your code as you type. With this feature, you don’t have to compile your code to see the errors. An LSP has many indicators to show you the errors in your code. Look at the explorer panel on the left side. There is a number next to the file name. This number shows you the number of errors in the file. Look at the mini map on the top right side of Figure 3. There is a red line on the mini map. This red line shows you the general location of the error within the file. This can help to find the errors in a long file. In the bottom of the IDE, there is a panel. This panel has many useful tabs. Up until now, we have only used the TERMINAL tab. Now, let’s look at the PROBLEMS tab. This tab shows you the errors in your code in a list format. You can click on the red cross-circle to go to the line that has the error. You can copy the error message by right-clicking on the error that is in the list. This can be useful if you want to search the error on the internet. At the end of the error message, there is a set of numbers. The ‘Ln’ tells you the line number of the error. (line 3) The ‘Col’ tells you the column number of the error. (column 36) Look at the red underline in the Figure 3. Exactly under the If you hover over the red underline, you will see the error message. Some IDE also show more information about the error. Look at the Figure 4. There’s even a quick fix available for this error. The quick fix gives you a suggestion to fix the error. You might not need to get your hands dirty with the code. With these tools we can easily find any compile time errors in code. As long as mankind learned the art of programming, they have used print statements to debug their code. It’s the least elegant way to debug your code, but it’s the most effective way to debug small programs. Look In the following code. Let’s say we expected the value of First thing we can do is to print the value of Output: Now we know that the value of Let’s print the value of Output: Gotcha! The value of Don’t forget to remove the print statements after you fix the bug. Just to keep your code clean. Output: So what happens when your program gets bigger? Or when you’re not sure about all the weird edge cases? That’s where unit testing comes in. Think of it as writing code to check if your other code is behaving itself. Going full-on into unit testing is a whole other adventure, but let’s peek at a quick example to see why it’s so cool. Let’s say you’ve got this Code to be tested: Instead of running your app and printing stuff to see if JUnit Test Case: This little test automatically runs your Unit tests are a lifesaver on big projects. They act as a safety net, making sure that when you add a new feature, you don’t accidentally wreck an old one. They also kind of work as living documentation for your code. While a test won’t tell you exactly where the bug is like a debugger can, it will tell you what broke. And knowing what’s broken is half the battle. Here comes the most powerful tool that can save you hours of debugging. Debuggers are tools that allow you to run your code line by line. You can see the value of variables at each line of code. Don’t let Its name deceive you. Debuggers are not only used for debugging. Debuggers are great for: First let’s learn the bread and butter of debuggers. THE breakpoints. Breakpoints are the points in your code that you want to stop the execution of the code. You can set a breakpoint by clicking on the left side of the line number. Figure 6. Look at this example. Example: Let’s say you want to see the value of This is a debugging session. Figure 9. There are many useful tools in the debugger. Let’s go over them. One by one. But first let’s understand the flow of a java program. As for now, all we need to know is within the This brown octagon-arrow shaped button is the step indicator. Figure 10. This button shows the next line of code that will be executed. The code is paused on the line that is shown in the step indicator. Now we can see all the information before the execution of There are multiple ways to see the value of variables before stop of the flow. Figure 11. In left side, you can witness the variables panel. All the values before the stop of the flow are shown in this panel. You can hover over the variable to see the value of the variable. Hover over the The values for the variables are shown in the code, just after actual code. In a gray colored text You can call the value of a variable in the debug console. Figure 12. There’s no need to use the Let’s add a breakpoint on line 10. We will make use of this second breakpoint later in this section. This is the debug toolbar. Figure 13. From left to right: This button continues the execution of the code until the next breakpoint. Remember, the flow of execution is paused on the line that is indicated by the step indicator, So the This button stops the flow of execution on the next line of code. No matter if there is a breakpoint on the next line or not. So as an example you can put a breakpoint on line 3 and click on the step over button. The flow of execution will stop on line 4. Next button press will stop the flow of execution on line 5. Figure 15. This button action is similar to the step over button. The difference is out of the scope of this tutorial. (useful for debugging methods) The action of this button is out of the scope of this tutorial. (useful for debugging methods) This button restarts the debugging session. It’s useful if you want to debug the code multiple times. Or you have changed the code, and you want to debug the code again. This button stops the debugging session. It also Disconnects the debugger, so you can go back to the normal mode of the IDE and run the code normally. Normally, If you don’t need a breakpoint anymore, you can remove it by clicking on the breakpoint, But there are times that you want to keep the breakpoint, but you don’t want it to stop the flow of execution. (for now) In this case, you can disable the breakpoint. Figure 16. Debuggers have many more advanced features. But these features are out of the scope of this tutorial, However I will mention some of them here. Normally, the debugger stops where you asked for a breakpoint. If you are in a loop or have a clue what values trigger the problem, you don’t want that. A conditional breakpoint allows you to add a bit of Java code to your breakpoint, so it will only stop when that condition is true. This approach avoids having to hit resume a lot of times until you get to the value you care about. This feature is especially useful for debugging loops. Watchpoints are similar to breakpoints. But instead of stopping the flow of execution, they just print the value of the variable. This is better than using print statements because you don’t have to remove the watchpoint after you fix the bug. You can Manually change the value of variables in the debugger and let the code continue the execution with the new value instead of the original value. This helps you test potential fixes, without having to change the code. Debugging is one of the most important skills of a programmer. It’s a skill that you will use every day. It’s a skill that you will use in every project. Learn it, Use it, Master it. And as always, Happy coding! Don’t be this guy! Be this guy! Every IDE has its own debugger. So the documentation of the debugger is different for each IDE. Head over to the documentation of your IDE to learn more about the debuggers. Introduction
How to find compile time errors
Compile the code
)
test.java.
3.
)
Other examples
}
test.java5reached end of file while parsing1compilation failed}
;
test.java3')' or ',' expected1compilation failed)
;
test.java4not a statement1compilation failed
)
test.java3 and 4';' expected and unclosed string literal2compilation failed; and "
IDE’s Language Server Protocol
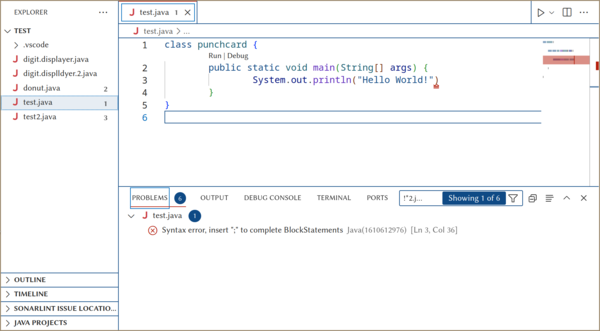
[Ln 3, Col 36]
) in the line 3.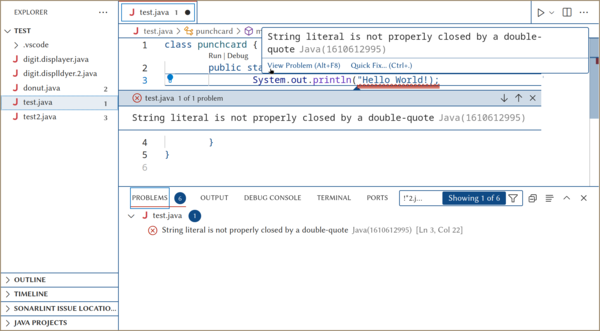
How to find runtime and logical errors
print statements
a to be 5 and b to be 10. As a result, we expected the value of c to be 15. But for some reason, the value of c is not 15.c to see what the value of c is.
c is 22. But we still don’t know why the value of c is 22.a and b to see what the value of a and b are.
a is 12. That’s why the value of c is 22. We can fix the bug by changing the value of a to 5.
Unit testing or test cases
Calculator class:
add works, you can write a special test for it. With a tool like JUnit, it looks something like this:;
;
add method with 2 and 3 and screams at you if the result isn’t 5. If you change your add method later and accidentally break it, this test will fail and let you know immediately. It’s like having a personal robot that constantly checks your work.
Debuggers
Basics of debuggers
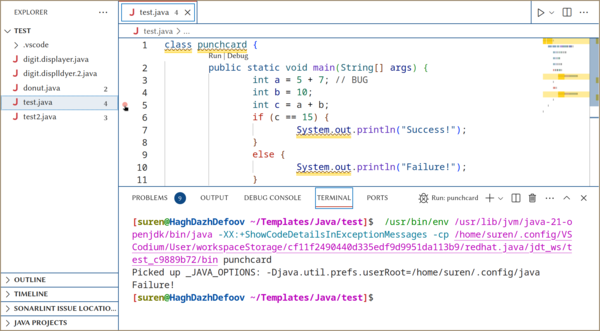
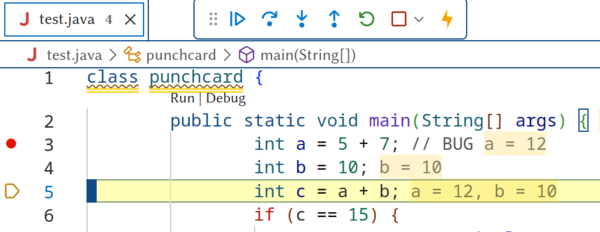
a and b before the if statement. You can set a breakpoint on the line 5 and click on the debug button. Figure 8.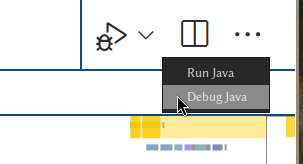
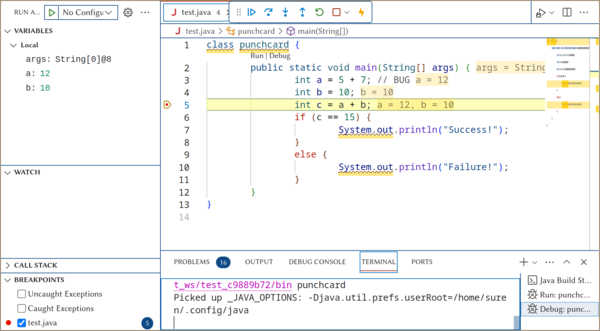
public static void main(String[] args), the code is executed line by line from top to bottom. Step Indicator
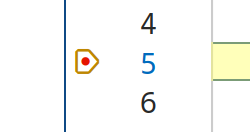
c = a + b;. Variables

a in the line 3. Displays the value 12.System.out.println() to see the value of a variable. Just write the variable name in the debug console prompt and press enter.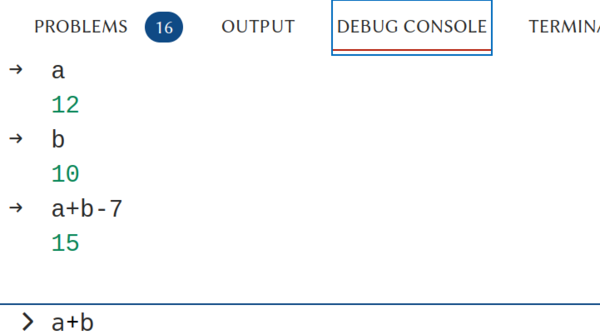
Debug Toolbar

System.out.println("Failure!") is not executed yet. Figure 14.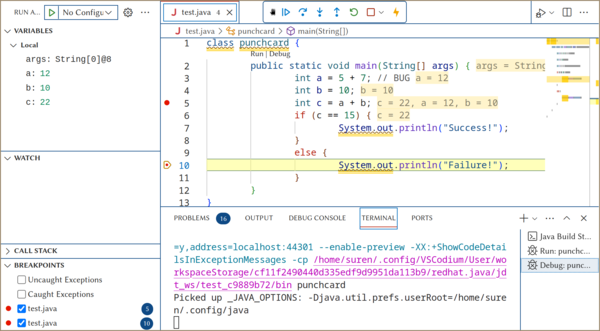
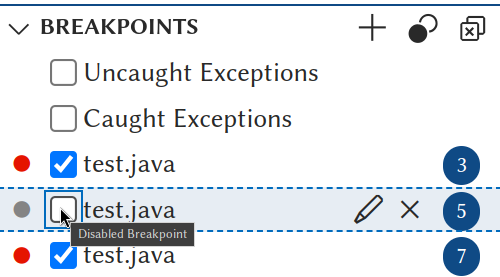
Breakpoints
Advanced debugging
Conditional breakpoints
Watchpoints
Changing the value of variables
Conclusion
Documentation